Historical Asset Sales Prices

US Petroleum Refinery Sales

Watson Millican & Co. evaluates refinery sales through extensive research and our development of metrics to provide insight into the market prices for refineries. Sales prices for U.S. petroleum refineries can be expressed using a variety of different bases, each providing a unique perspective. Two different bases are provided here, as examples, for the sale of U.S. petroleum refineries during 2001-2025. First, the sales are shown on a $/BPD crude distillation capacity. Second, the sales are shown on a % of replacement cost new basis. Both charts illustrate the range of sales prices that occurred during the past 25 years. Sales prices between refineries can vary widely for many reasons not fully captured by the use of a single basis. The data is provided as an illustration only and is not to be construed as an analysis of sales for use in valuing petroleum refineries.

Sales Prices of U.S. Petroleum Refineries
2001-2025
Expressed As $/Distillation Capacity (BPSD)

Sale Prices of U.S. Petroleum Refineries 2001-2025 Expressed As $/Distillation Capacity (BPSD)

Sales Prices of U.S. Petroleum Refineries
2001-2025
Expressed As % of Replacement Cost New

Sale Prices of U.S. Petroleum Refineries 2001-2025 Expressed As % of Replacement Cost New​

North American Midstream Transactions EBITDA Multiples

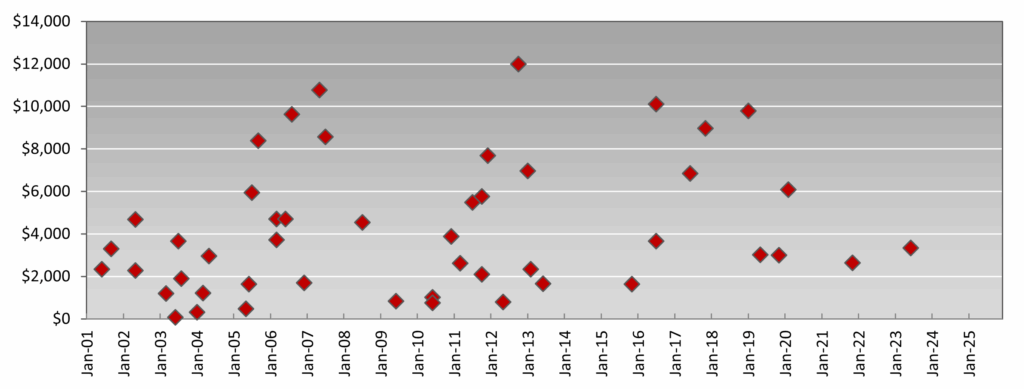
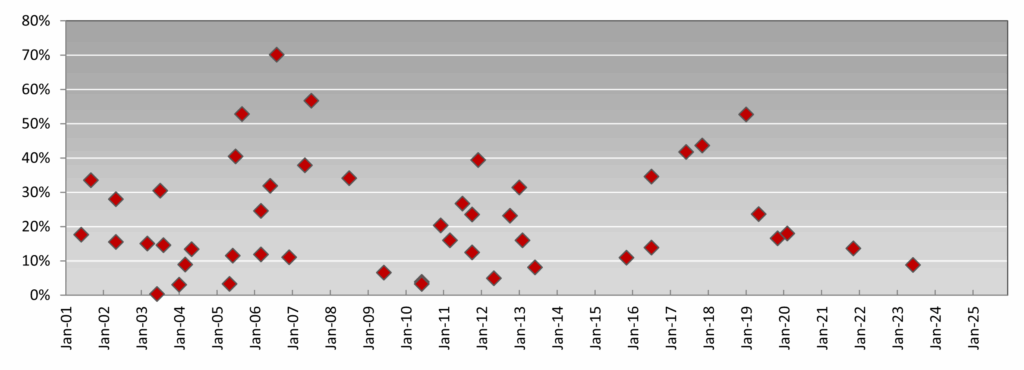
Watson Millican & Co. tracks transactions of midstream assets in North America including gathering systems, processing plants, pipelines, storage facilities, and terminals. Sales prices for midstream assets are often expressed as a multiple of EBITDA (sales price divided by earnings before interest, taxes, depreciation, and amortization). The chart below illustrates the range of EBITDA multiples for representative transactions that occurred during the past 22 years along with a general trend line for transactions with a sales price of (1) less than $1 billion or (2) greater than $1 billion. Sales prices of midstream assets can vary widely for many reasons not fully captured by the use of a single metric. The data is provided as an illustration only and is not to be construed as a definitive analysis of sales for use in valuing midstream assets.

Sales Prices of North American Midstream Assets
2004 through 2025
Expressed As EBITDA Multiple